How Low-income Transit Riders in Boston Respond to Discounted Fares: A Randomized Controlled Evaluation
Jeffrey Rosenblum, Jinhua Zhao, Mariana Arcaya, Justin Steil, P. Christopher Zegras
Department of Urban Studies and Planning
Massachusetts Institute of Technology, Cambridge, MA
Preliminary Results Report (June 2019)
For more information contact Jeff Rosenblum at jeffreyr@alum.mit.edu. LinkedIn.
The purpose of this project is to investigate how the cost of public transit influences low-income transit use and access and, thus, how a low-income fare policy instrument could improve the quality of life of low income transit users. A randomized controlled evaluation was conducted to study the effect of providing a 50% discounted MBTA fare to low-income individuals in the Boston region. Individuals receiving food stamps (SNAP) benefits were recruited and then randomly assigned to either receive a 50% discount CharlieCard or a regular CharlieCard. Participants daily provided the purposes of their transit trips via an automated text-based mobile-phone ChatBot tool. Pre- and post-study surveys were also administered by the ChatBot.
Preliminary findings of our research suggest low-income riders in the study took more trips as a result of receiving a subsidy. Compared to the control group receiving only a CharlieCard, those participants receiving a 50% discounted CharlieCard:
- Took about 30% more trips.
- Took more trips to health care and social services.
The research also suggests that low-income transit riders in the study use the MBTA differently from the average transit rider. Compared to the average MBTA rider, the low-income individuals participating in the study:
- Took more of their trips during off-peak times.
- Relied more heavily on buses and Silver Line.
- Made more transfers among modes and routes (e.g., subway to bus to another bus).
- More often paid with stored value on a card rather than one-day, seven-day, or monthly passes.
Finally, in answer to the question, “What do you think is the biggest problem with public transportation (MBTA) in Boston?” participants in the study:
- Reported reliability, affordability, frequency, and crowding as top concerns.
Preliminary Results Report (June 2019)
Recent presentation
Presentation slides April 20, 2022
Dissertation
Abstract
Over the past five years, as transit fares have been rising faster than inflation, interest in establishing programs providing discounted public transit fares to low-income individuals has blossomed in the US . Limited research exists, though, on how affordability of the fare influences travel behavior, and affects access, to destinations such as healthcare, and, ultimately, quality of life. This hampers efforts by policy makers and advocates to evaluate the potential for means-tested fare programs as an intervention to ameliorate the impacts of transit costs. This research aims to answer the following questions: 1. How do travel patterns of low-income transit riders differ from those of average riders? 2. What is the causal effect of a fare subsidy on the number of trips taken by low-income riders? 3. In what way does transit cost impact healthcare utilization for low-income individuals? 4. How do low-income transit riders decide whether to purchase a pass or pay for trips individually?
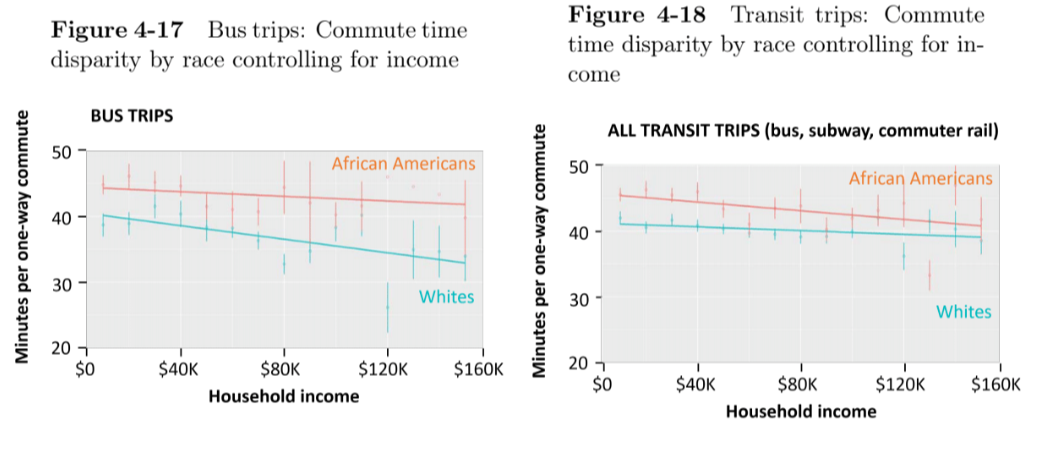
50% fare subsidies cause an increase of 2.3 trips per week (27%), equivalent to a fare elasticity of − 0.54. There is a statistically significant treatment effect on trip rates to healthcare appointments, and evidence from the interviews suggest that trips for regular maintenance visits for chronic conditions are the type of healthcare visits likely to be forgone because of an inability to afford the transit fare. I found that scarcity mindset , the behavioral economics theory which suggests that living in poverty impedes cognitive capacity, is not universal among low-income individuals. I also found that 30% of individuals paying for trips individually would have received better value by purchasing a pass product. Low-income riders take proportionally more off-peak trips, and African Americans have longer commutes even controlling for income.
A major policy implication of this research is that means-tested fare programs will provide tangible benefits to its recipients because the cost of public transit has been shown to limit mobility of low-income residents. This research also suggests that healthcare providers should be proactive in providing free public transit for patients. Next-generation fare collection systems will open the door for innovative collaboration with other social service agencies. The findings in this dissertation inform the future of public transit fare policies. Finally, with evidence of travel time disparities by race, structural causes must be addressed.
Excerpts
(1) How do travel patterns of low-income transit riders differ from those of average riders?
Mobility patterns of low-income individuals compared with the average population is poorly understood, largely resulting from data that is not able to be segmented by income. Resource-intensive passenger surveys are one source, though often are limited because of low respondent numbers or lack of representativeness (Schaller, 2005). National Household Travel Survey data, useful for high-level national trends, does not provide fine-grained city- level information. US Census data does not provide pre-tabulated products for income and commute-to-work mode. Researchers often associate average demographics of detailed census tracts with boardings at nearby transit stops, but this approach has limitations (Karner, Kuby, & Golub, 2015). Lastly, Big Data from transit agency smart cards is not helpful for understanding low-income rider behavior because user demographic information cannot easily be associated with individual smart cards. Segmentation analyses can be conducted to differentiate travel behavior of seniors and persons with disabilities because of the application process required to obtain those cards. As a last resort, Data regarding seniors and persons with disabilities are often used as a proxy for low-income individuals, but are poor substitutes.
I take three different approaches to identify ways in which travel patterns of low-income transit riders differ from average riders using descriptive statistics derived from several data sources. First, I obtained and analyzed the raw records from the latest MBTA passenger survey to investigate differing mobility patterns of low-income and minority riders, such as the number of trips taken, modal split between bus and subway, and household car ownership. This dataset has not yet been mined for insights into differential travel behavior based on income.
Secondly, I compared the dataset of smart card usage generated by the low-income population in my study with smart card data of all MBTA riders to identify differences in time-of-day travel, an issue that is poorly documented yet has important implications for fare policy. The hypothesis is that low-income riders take a higher percentage of their trips during off-peak hours, information not currently available from the MBTA’s automated fare collection system.
Finally, I used the American Community Survey Public Use Microdata Sample data, a set of untabulated census records, to investigate how commute time correlates based on race and income. A previous study concluded that race correlates with travel time but did not correct for income (Pollack, 2012) leading me to hypothesize that income is the true correlate to travel time, not race (I found the opposite to be true: race correlates with travel time irrespective of income.)
(2) What is the causal effect of a fare subsidy on the number of trips taken by low-income riders?
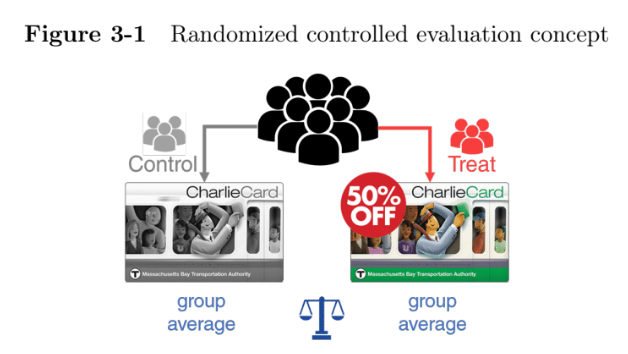
To address this question, I designed and implemented a randomized controlled evaluation experiment. This methodology has seen rapid growth in social science research as it can accurately determine the impacts of social interventions by eliminating confounding factors (Angrist & Pischke, 2014). Alternatives, such as econometric or qualitative approaches, do not provide the same level of confidence in the results because of the problem with lurking confounders. A well-run randomized controlled evaluation can successfully isolate the specific intervention of interest from the multitude of possible other covariates allowing researchers to draw causal conclusions.
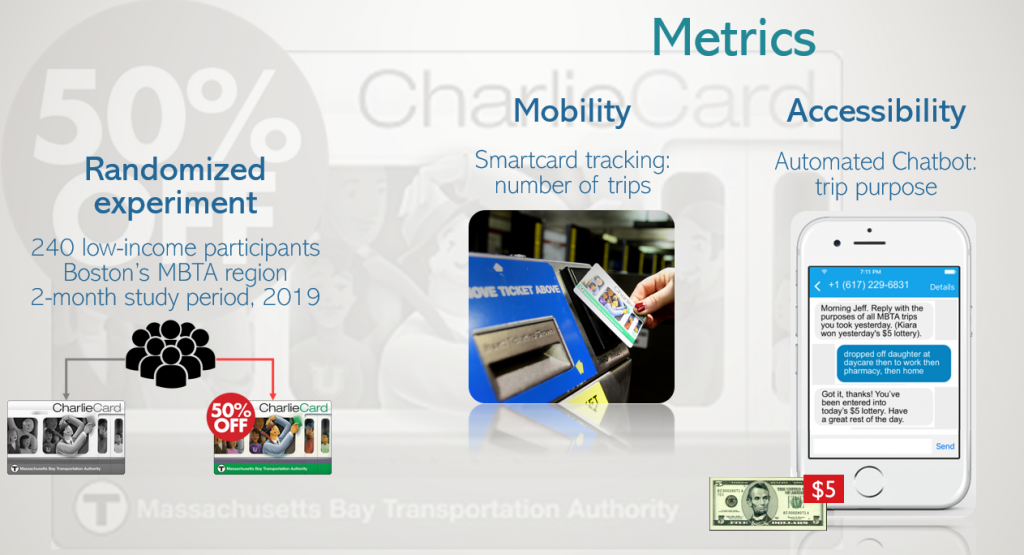
To test the effect fare subsidy programs have on the level of mobility and access, I conducted a real-world randomized experiment on a sample of 242 transit riders in the Boston area who receive food subsidy benefits. Half were randomly selected to receive a special smart card that automatically provided a 50% discount (the treatment group) while the others were provided a standard smart card (the control group). The study was conducted from January 2019 to June 2019. Each participant was engaged in the study for a two-month period. Boston was selected as the case site location because of its suitability for a low-income fare program and because of the willingness of the transit agency, the Metropolitan Bay Transportation Authority (MBTA), to collaborate. In order to run the study in real-world conditions that would exist if a low-income fare program was implemented, special smart cards for treatment group participants needed to automatically provide a discount in real time. Reimbursing participants after the fact would likely impact participant behavior by removing the instant discount feature.
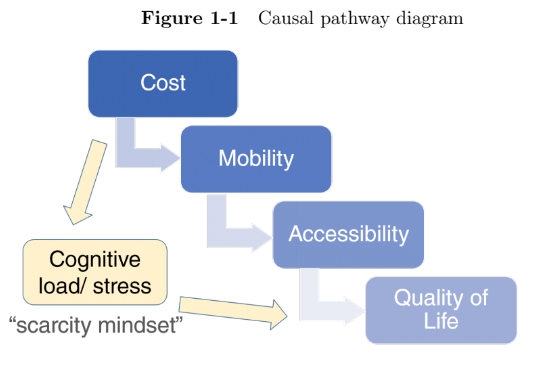
With long-term effects of policy interventions difficult to measure, researchers resort to shorter-term intermediary metrics that can be more easily operationalized and measured over a shorter period of time. Relying on existing theory, assumptions are then made on the expected downstream effects. For social safety net interventions such as discounted transit fares, the policy objective is to improve recipient outcomes, such as income, health, and quality of life. My hypothesis is that transit cost is a barrier and that a low-income fare will increase the number of trips taken. If a reduction in transit cost does increase the number of transit trips taken by low-income individuals, then it is assumed that that increased access to important goods and services will follow, which is then assumed to improve quality of life outcomes.
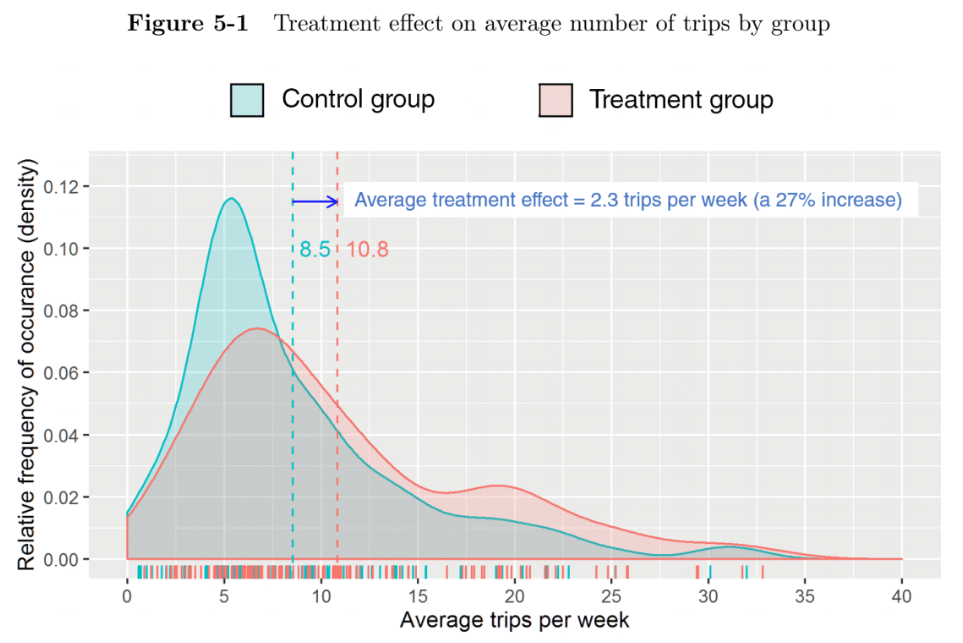
This causal pathway framework is shown in Figure 1-1 (the scarcity mindset pathway is addressed with question 4 below). The randomized controlled evaluation operationalized the concepts of both mobility and accessibility as dependent variables. Mobility was represented by the number of transit trips taken as reported by smart card data. To measure accessibility, trip rates for different trip purposes were determined from data reported by participants to the travel diary, thereby illuminating whether certain types of trips, such as work, healthcare, training, visits to family, or shopping, are more sensitive to the cost of public transportation. Although some evidence suggests that discretionary trips are more likely to be forgone because of cost, this has not been rigorously studied (Perrotta, 2017). My hypothesis is that both necessary and discretionary trip types are impacted by a fare subsidy. Because of the large number of zeros in the count data for number of trips taken in different categories, a zero-inflated negative binomial regression model was used to further investigate the treatment effect.
(3) In what way does transit cost impact healthcare utilization for low-income individuals?
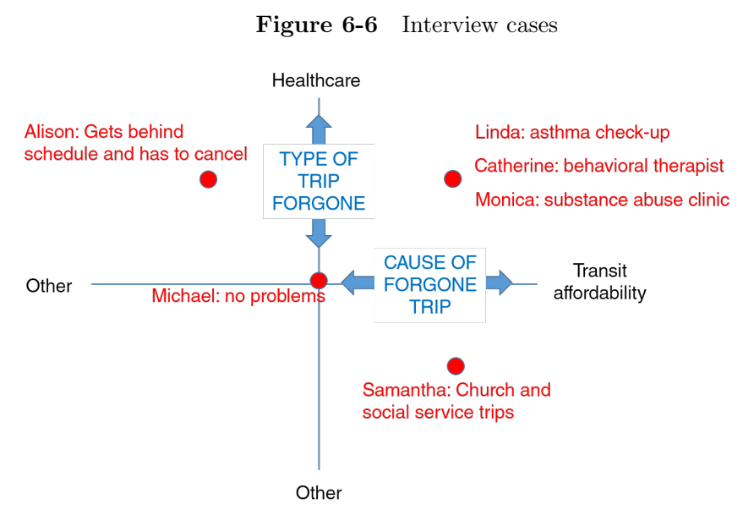
Improving the health of low-income individuals is an important policy objective, especially because income correlates highly with health risk factors such as higher rates of heart disease, stroke, diabetes, obesity, hypertension, or physical limitation (Center for Health Statistics, 2012). Health literature points to maintenance visits for chronic illness as an important correlate to better health outcomes, especially for low-income individuals, because chronic illnesses can quickly destabilize causing significant long-term health impacts (NCHS, 2017). It is likely that individuals prioritize acute healthcare needs differently from regular routine maintenance visits for chronic illnesses, but this issue has received minimal research focus in the transportation field. My hypothesis is that when transit cost is an issue, individuals are more likely to forgo healthcare trips for chronic conditions, but not for acute illnesses or emergencies. Participant interviews were used to illustrate the impact of transit affordability on access to healthcare.
(4) How do low-income transit riders decide whether to purchase a pass or pay for trips individually?
Low-income riders can be disproportionately impacted by transit fare policies. How they choose to pay for fares, or otherwise compensate, is poorly understood. For example, it is known that larger up-front cash outlays for monthly passes are challenging and as such, low-income individuals may not get the best value over the course of the month (Barajas, Chatman, & Agrawal, 2016). How a low-income fare product is implemented is likewise important- providing only discounted monthly passes or including discounting pay-per-ride in the program may have important ramifications on the travel behavior of and financial benefits for low-income riders. There are also new considerations on the horizon. Recent technological improvements in transit fare collection systems have opened up possibilities for innovative fare products such as fare capping where customers pay for each trip individually but when a certain payment threshold is reached within a designated time period, subsequent trips in that period are automatically free (K. Taylor & Jones, 2012). The concept of mobility as a service (MAAS) is another, whereby transportation payments for various modes including public transit may be bundled together (Buehler, 2018; Watkins, 2018). To ensure equity is part of the policy development process, a better understanding is needed regarding how low-income riders make fare payment decisions.
To better understand how low-income riders make payment decisions, I incorporated theories from behavioral economics literature. Recognizing that people do not necessarily make what would appear to be logical, rational decisions, transportation researchers are turning to behavioral economics approaches. In the context of studying people living in poverty, these theories and insights have proven useful in better understanding how living with scarcity influences cognitive capacity. Referring back to Figure 1-1, there is also a pathway linking the stress of poverty with diminished health outcomes (Selye, 2013). An assumption can then be made that relieving stress associated with paying for transit or making individual trip decisions will lead to improved health outcomes. In order to better understand the sources of such stress, I propose a two-tier process to describe how purchasing and traveling decisions are made: first whether or not to purchase an unlimited weekly or monthly pass product, and second, if a pass is not purchased, whether or not to take each individual trip. I focused my analysis on how people made the decision to purchase a weekly or monthly pass or to pay for transit trips on an individual basis.
My hypothesis is that low-income individuals prefer to pay per ride because of lower up-front cost, resulting in forgone trips and increased stress. For this investigation, I used a combination of smart card usage data and participant interviews. Smart card data revealed how each participant chose to manage each transit payment over the study period and the interviews provided insight into the thought process. A unique feature of this analysis is that for each participant interviewed, I was able to cross reference observed payment behavior with that individual’s perspectives.
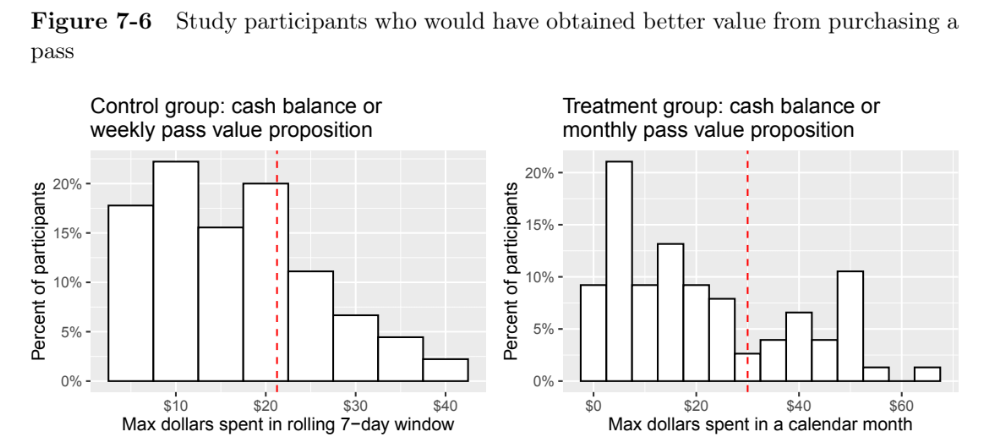
For each control group participant paying with cash balance, a rolling 7-day total expenditure was calculated. 30% of these participants had at least one window, over the course of the study, where it would have been financially beneficial to have purchased a weekly pass. In a similar fashion, for each treatment group participant paying with cash balance, a 30-day total expenditure by calendar month was calculated. Similarly, 30% of the treatment group participants would have benefited financially from having purchased a discounted $30 monthly pass at least once. The same percentage held true for both control and treatment groups even though the pass types differed.
ChatBot tool
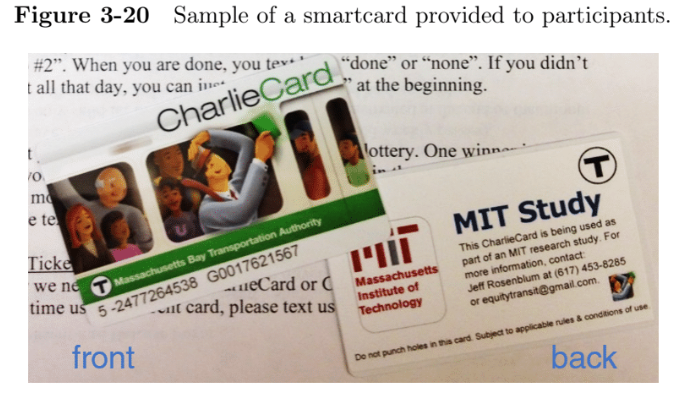
The ChatBot tool itself is a contribution of this research project. With the high penetration rate of smartphones, even among low-income populations, researchers have recently turned to these devices as tools for data collection. Custom designing apps is challenging. It involves accommodating various devices, screen sizes, and operating systems, programming a robust user interface, and ensuring reliability and robustness. Users are often reticent to download third-party apps because of limited storage space, battery drain, and privacy concerns (Hoch, 2015). Low-income individuals pose additional challenges because they have less consistent internet connectivity than average smartphone users (Smith, 2015). For these reasons, I opted for a text/SMS messaging platform as an alternative to a smartphone app (Figure 1-2).
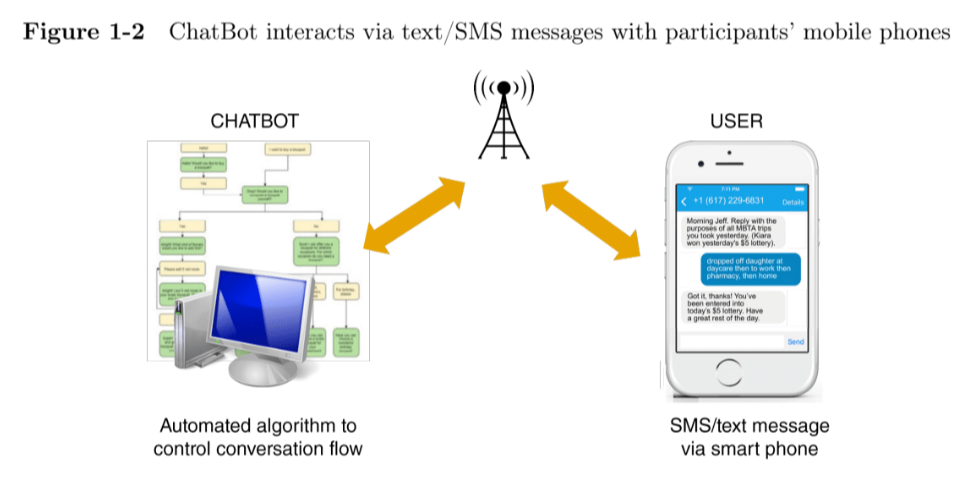
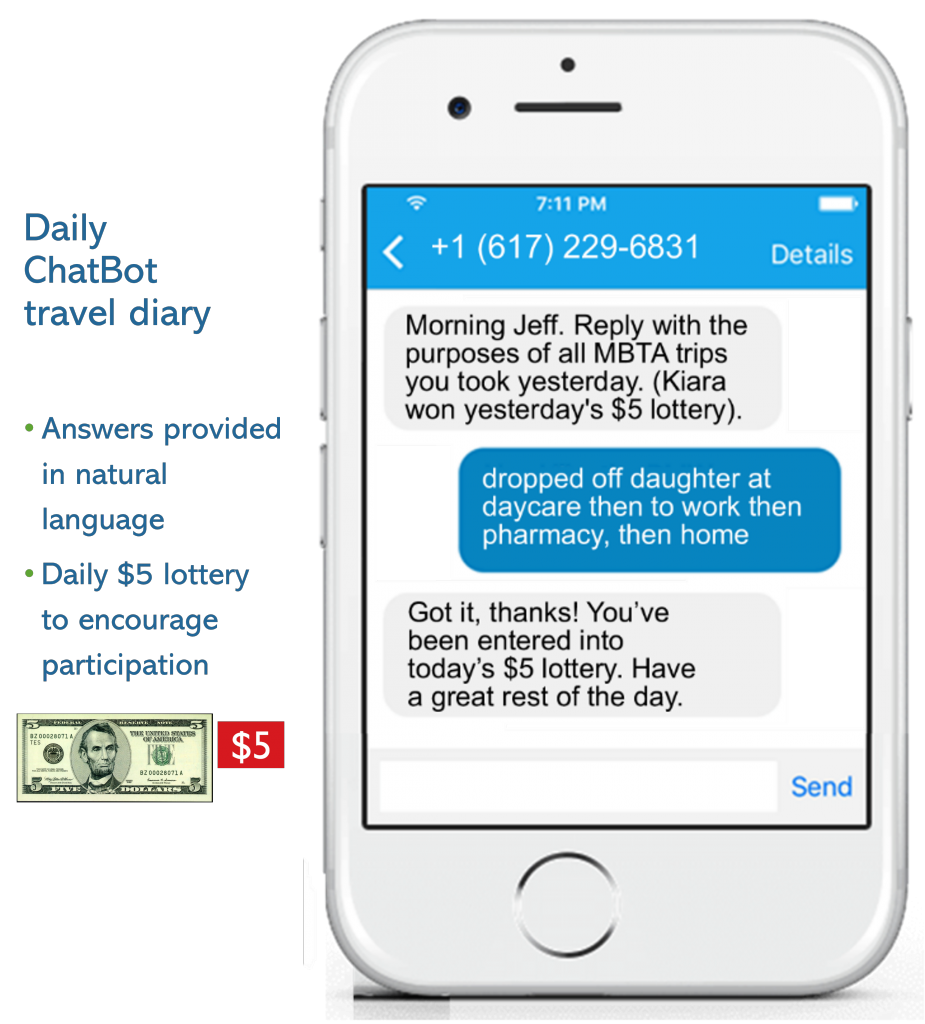
While there are many examples of the use of text messaging by health intervention programs, political campaigns, and in international development contexts, there are limited examples of its use to engage participants in other research. I custom-designed a ChatBot tool to automate participant recruitment as well as collect daily travel diary information from the participants. I was granted permission by MIT’s Institutional Research Board to obtain participant consent via text message rather than paper signature, thereby reducing a significant barrier to enrollment rates. Programming the ChatBot was far simpler than for a custom designed app and the cost associated with the SMS interface with the cellular network was low. There was a very high response rate to the daily ChatBot diary, with participants responding to the daily ChatBot text requests an average of 73% of the time.
Following successful implementation for my research, the ChatBot tool has been adopted by multiple other research teams: a Notre Dame research team utilized it in a study evaluating the impact of free-fares in Seattle, and a researcher at MIT, in collaboration with the Boston Redevelopment Authority, deployed it in a study involving housing vouchers.
Press Coverage
- Low-income fare for T riders could bring much-needed relief to poor squeezed by inflation.
 (July 15, 2022)
 - MIT Study: High Fares Limit Low-Income Households’ Mobility

- MBTA Urged To Explore Low-Income Rider Fare Subsidy

- Special fare for low-income T riders gains momentum: Some control board members back more commuter rail discounts

- MBTA considers discounted fares for low-income riders

- Transit advocates push for MBTA discounts for low-income residents

- Wu: MIT study backs push on cut in MBTA fares for low-income riders

- Low-income T riders take mass transit more when fares are lowered, study says

- MIT: Discounted fares prompt more transit use among low-income Bostonites

- T plans study of low-income fare